Ir Med J. 2006 Nov-Dec;99(10):307-10
Abstract
Diabetes mellitus is the most common chronic metabolic disease and a major source of morbidity and mortality. Type 2 diabetes (T2D) is by far the most prevalent form of diabetes accounting for around 90% of cases worldwide. In recent years it has become apparent that a diabetes epidemic is unfolding as a result of increasing obesity, sedentary lifestyles and an ageing population. The enormity of the diabetes epidemic raises concern about the total cost to healthcare systems. This study was undertaken to investigate the direct healthcare costs of managing T2D in Ireland. Data was captured on 701 diabetes patients attending four diabetes centres. A bottom-up, prevalence-based design was used, which collected data on hospital resource use and clinical outcome measures over a 12-month period (1999/2000). The study was observational in nature, focusing on usual care of patients with T2D. Although the true prevalence of T2D in Ireland is unknown, conservative estimates are 3.9% for diagnosed diabetes and 6% for both diagnosed and undiagnosed diabetes. Using these figures the annual total direct cost was estimated at 377.2 million for diagnosed diabetes and 580.2 million for both diagnosed and undiagnosed diabetes. This corresponds to 4.1% and 6.4% of total healthcare expenditure respectively. Hospitalisations were the main driver of costs, accounting for almost half of overall costs, while ambulatory and drug costs accounted for 27% and 25% respectively. Hospitalisation costs were high because 60% of patients had developed complications. The most common microvascular and macrovascular complications were neuropathy and angina respectively. The annual cost of care for patients with microvascular and macrovascular complications were 1.8 and 2.9 times the cost of treating those without clinical evidence of complications respectively. The figure for patients with both types of complications was 3.8. This study shows that T2D is a very costly disease, largely due to the cost of and the management of complications. Many diabetes related complications are preventable, therefore it would appear a cost-effective approach for government to invest in the prevention of T2D and diabetes related complications.
Introduction
Diabetes mellitus is the most common chronic metabolic disease and a major source of morbidity and mortality. Type 2 diabetes (T2D) is by far the most prevalent form of diabetes accounting for around 90% of cases worldwide.1 In recent years it has become apparent that a diabetes mellitus epidemic is unfolding. In 2003 an estimated 194 million people aged 20-79 years had diabetes worldwide, representing a prevalence rate of 5.1%. By 2025 it is projected that this figure will rise to 333 million representing an increase of 71% in 22 years.2 Increasing obesity, sedentary lifestyles and an ageing population are reasons for the expected rapid growth in the number of people with T2D.
In Ireland, although national prevalence data for most diseases are not available, 3.9% of the 50-69 age group in the Cork and Kerry Diabetes and Heart Disease Study had T2D, with 30% of cases undiagnosed.3 Other Irish studies estimated prevalence rates of 2% and 4.7% by using prescription data4 and applying UK data in an Irish context respectively.5 However the proportion of undiagnosed cases were not determined in these studies. As such, these figures are likely to underestimate the true prevalence of the disease as there is evidence to suggest that the prevalence of undiagnosed diabetes could be as great if not greater than that of diagnosed diabetes. For example, the DECODE study found that the prevalence of known diabetes across 16 European countries covering over 26,000 subjects was 3.7%. However, when undiagnosed cases were included this figure rose to between 7.2% and 7.7%.6 Similarly, the World Health Organisation (WHO) reviewed 19 recent studies on the prevalence of known and previously undiagnosed diabetes.7 It showed that in 13 of these studies the prevalence of undiagnosed was as great as or greater than diagnosed diabetes. Therefore while the exact prevalence of T2D in Ireland is not confirmed, it is certain that the numbers presenting with T2D will increase following global trends for obesity, physical activity and ageing.
Due to the chronic nature of the disease, T2D is very costly to treat. For example, a US study showed that the direct costs of diabetes was $91.8 billion in 2002.8 A UK study found that the direct cost of diabetes accounted for 4-5% of the total health budget,9 similar to the estimates of 5.8% reported in a Finnish study.10 The recently published results from the CODE-2 study found that the total direct medical costs of managing more than 10 million patients with T2D was 29 billion a year at 1999 prices, which in some countries represented over 6% of total health care spending.11 In these and other studies, the high cost of managing T2D was attributable largely to the management of the long-term complications of the disease.
With the growing prevalence of diabetes in Ireland, comprehensive economic data is required to ensure that appropriate resources are allocated to the management of the disease. This data is currently not available. Hence, the primary objective of this study was to quantify the cost of T2D to the Irish health care system. These costs related primarily to the utilisation of primary and secondary care services and the provision of diabetes related medications. Secondary objectives of the study were to identify and quantify the main cost drivers and to establish the impact of complications on the cost of managing T2D.
Methods
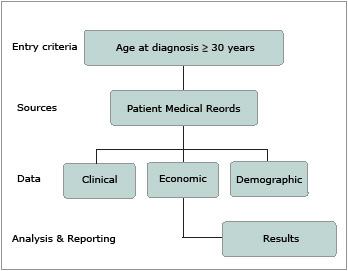
CODEIRE (Cost Of Diabetes in EIRE) was an observational study that collected data on resource utilisation and outcome measures for patients with T2D from hospital diabetes centres in Ireland in 1999/2000. An overview of the study design is presented in Figure 1. Patients attending the hospital diabetes clinic were already clinically diagnosed with T2D and were included if age at diagnosis was at least 30 years.
 |
|
Figure 1: Overview of Study Design |
Computerised lists of patients attending hospital diabetes centres were not available, however it was noted that patients typically attended at regular six-month intervals. The daily appointment schedule from four hospital diabetes centres (St. Jamess Hospital, Mater Hospital, University Hospital Cork and St. Vincents Hospital) was used to generate a random sample of 701 patients. Hospital records for these patients were then used to identify clinical outcomes and all healthcare resources used. Each diabetes centre was equally represented in the study cohort that represented both urban and rural areas. Ethics committee approval and written patient consent were obtained prior to study initiation.
Information collected included inpatient hospitalisations, attendance at Accident and Emergency (A&E) departments, specialist and primary care consultations, prescription medicines, as well as diagnostic and surgical procedures. To investigate the distribution of costs, resource use was separated into three categories: hospitalisation, ambulatory and drug costs. Hospitalisation costs were defined as the sum of costs of all inpatient hospital admissions. Ambulatory costs included the costs of visits to GPs, diabetologists and other specialists, A&E visits and all tests and procedures that were recorded in the patient charts. Drug costs were the sum of the cost of all prescribed drugs used in the management of T2D.
| Table 1 Expenditure Categories and Unit Costs, 2003 |
| Expenditure Categories |
Unit Costs (€) |
| Ambulatory Costs (per visit)1 |
| GPs |
30.9 |
| Diabetologist |
157.0 |
| Nurse specialising in Diabetes |
66.3 |
| Ophthamologist |
97.3 |
| Other Specialists |
156-232 |
| Paramedics |
26-183 |
| Accident & Emergency |
216.6 |
| Hospital diabetes clinic visit (admin charge) |
48.6 |
| Diagnostic tests and procedures (per test) |
| Blood glucose |
4.0 |
| Urine glucose |
3.9 |
| Glucose Tolerance |
24.3 |
| HBA1c |
11.9 |
| Total Cholestrol |
3.8 |
| Triglyceride |
2.9 |
| Cholestrol and Triglyceride |
3.6 |
| HDL |
5.7 |
| Full lipid Screen |
7.2 |
| Liver function test |
7.4 |
| Hospitilisation Costs (per day) 2 |
| ICU |
1303.2 |
| CCU |
674.7 |
| Other wards |
617.0 |
|
Sources
- All ambulatory costs with the exception of the cost of diabetes clinic visit was sourced from a Cambridge Pharma Consultancy Report, 1999
- Hospitalisation and hospital diabetes clinic visit costs were sourced from the National Pharmaceoeconomic Centre. Patient Medical Records Results Demographic
|
Unit costs for the expenditure categories were obtained and then applied to utilisation data to generate per patient costs. The expenditure categories and unit cost data are presented in Table 1. Ambulatory cost data (with the exception of the cost of a diabetes clinic visit) were derived from UK costings for 1997/1998.12 Hospitalisation and diabetes clinic visit costs were provided by the Irish National Centre for Pharmacoeconomics and were in 1999 prices. All costs were inflatedto 2003 prices using annual health inflation figures from the Central Statistics Office13 and converted to Euro. Drug costs were derived from the Irish Monthly Index of Medical Specialties (MIMS).
In estimating ambulatory costs, it was found that not all consultations with diabetologists and nurses specializing in diabetes were recorded on the patients charts. This is despite the fact that it was standard practice for all patients visiting the diabetes clinics to consult with a nurse on every visit and a diabetologist at least once a year. As such, it was assumed that each visit to the diabetes clinic incurred a cost of 66.3 and that every patient had at least one visit to the diabetologist per year at a cost of 157 (see Table 1). In addition, an administration charge was added to the cost of every visit to the diabetes clinics to cover costs of non-medical support staff.
For drug costs, the drugs prescribed to each patient over a twelve-month period were recorded in the CODEIRE database. The name of the drug, dosage, frequency and the number of days for which the drug was prescribed were also captured. To calculate drug costs, the average price per tablet as listed in MIMS was applied to the data on frequency and the number of days over which the drug was used. However, as there were inconsistencies or gaps in the drug data some assumptions were necessary.
- In cases where the generic name was recorded rather than the brand name, the average price of all the brand name drugs under the generic name was used to calculate costs.
- In cases where, the frequency and/or number of days for which the drug was prescribed was missing or recorded as PRN (as required) two scenarios were created and costed separately. Under the first scenario, it was assumed that the patient purchased one pack of the drug over the twelve-month period. Under the second scenario, it was assumed that the patient purchased six packs over the twelve-month period. Where the brand name of the drug was not specified the lowest priced pack under the generic name was used.
- Previous studies have shown that about 15% of patients fail to redeem their prescriptions14. As such, another sensitivity analysis was conducted to show the variation of non-compliance on drug costs. Under the first scenario, it was assumed that 100% of patients redeem their prescription.
The figure for the second scenario was 85%.
| Table 2 Summary Statistics sourced from the National Pharmaceoeconomic Centre |
| |
Mean |
Standard deviation |
| Age (years) |
64.3 |
10.4 |
| Body Mass Index (kg/m^2) |
29.8 |
5.8 |
| Time since diagnosis (years) |
6.7 |
6.5 |
| Gender (males, %) |
57% |
|
| Primary treatment type |
| Diet and exercise only |
18% |
|
| Oral anti-diabetic medication monotherapy |
40% |
|
| Oral anti-diabetic medication combination |
30% |
|
| Insulin alone or in combination |
12% |
|
| Complications |
| No complications |
41% |
|
| Microvascular only |
20% |
|
| Macrovascular only |
18% |
|
| Both |
21% |
|
| N=701 |
When per patient costs from the sample data were derived, these were then applied to the total number of people with T2D in Ireland which were estimated by applying prevalence rates to the total population in 200215 (3.917 million) .Given the unavailability of national prevalence data, the estimated prevalence from the Cork and Kerry study of 3.9% was used in the base case scenario. An additional scenario was considered using a prevalence figure of 6%, which was justifiable on the basis of the WHO study and other studies cited above.
Results
Demographics
The sample demographics and baseline characteristics are summarised in Table 2. The average age of patients with T2D was 64.3 years (SD 10.4), 57 per cent of these were male. The average time since diagnosis was 6.7 years (SD 6.5) and the average Body Mass Index (BMI) was 29.8 (SD 5.8). The most common treatment was oral anti-diabetic medication (70%) followed by diet and exercise alone. The majority of patients with diabetes developed complications from the disease with 21% developing both microvascular and macrovascular complications, 20% developing microvascular complications only and 18% developing macrovascular complications only. Table 3 shows that the most common microvascular complication was neuropathy (25.4%) followed by retinopathy (14.8%). Angina (22.1%) was the most common macrovascular complication followed by peripheral vascular disease with a prevalence of 16.1%. The prevalence of myocardial infarction was also high at 12.3%
| Table 3 Prevalence of Macrovascular and Microvascular Complications |
| Microvascular |
No |
% |
| Neuropathy |
178 |
25.4% |
| Manifest Neuropathy |
45 |
6.4% |
| Foot Ulcers |
42 |
6.0% |
| Amputation |
10 |
1.4% |
| Retinopathy |
104 |
14.8% |
| Laser Photocoagulation |
44 |
6.3% |
| Blindness |
5 |
0.7% |
| Microalbuminuria |
64 |
9.1% |
| Dialysis |
3 |
0.4% |
| Macrovascular |
| Angina |
155 |
22.1% |
| Percutaneous Transuminal Coronary Angioplasty |
46 |
6.6% |
| Coronary Artery Bypass Graft |
58 |
8.3% |
| Myocardial Infarction |
86 |
12.3% |
| Heart Failure |
35 |
5.0% |
| Transient Ischaemic Attack |
38 |
5.4% |
| Stroke |
27 |
3.9% |
| Peripheral Vascular Disease |
113 |
16.1% |
Resource Utilisation
For ambulatory resources, the sample data showed that patients had on average 2.3 visits to the diabetes clinic, 1.4 specialist, 0.23 GP, 1.3 paramedical and 0.17 A&E outpatient visits per year.
In relation to hospital resources used, 9.4% of the patients had been hospitalised because of diabetes during the previous 12 months with an average length of stay of 7.3 days (SD 4.9). Finally, patients had prescriptions for an average of 4.97 different drugs that were directly related to managing diabetes, its risk factors and complications.
Costs
Table 4 presents the average direct medical costs per patient. It shows that total direct medical costs per patient were 2469 per year. Per patient, hospitalisation costs were 1196, ambulatory costs were 661 and drug costs were 612. It was found that varying the assumption on the number of packs of drugs purchased by the patients had little impact on per patient drug costs. However, noncompliance with prescribed medication did have an impact on drug costs, with per patient drug costs falling to 520 per patient under the scenario of 85% of patients redeeming their prescription as opposed to 100% of patients under the base case.
| Table 4 Direct Medical Costs for Type 2 Diabetes by Main Category of Resource Use |
| |
Costs per patient (€) |
Overall costs (€m) |
| Base (3.9% prevalance rate) |
| Ambulatory costs |
660.9 |
101.0 |
| Hospitalistion costs |
1196.3 |
182.8 |
| Drug costs |
611.5 |
93.4 |
| Total |
2468.8 |
377.2 |
| Scenario 1 (6% prevalance rate) |
| Ambulatory costs |
660.9 |
155.3 |
| Hospitalistion costs |
1196.3 |
281.2 |
| Drug costs |
611.5 |
143.7 |
| Total |
2468.8 |
580.2 |
Hospitalisation accounted for almost half of overall costs. Ambulatory and drug costs accounted for 27% and 25% per cent respectively. Visits to the diabetes clinic accounted for the largest proportion of ambulatory costs (50%). Consultations with specialists, paramedics, A&E attendances and undergoing tests and procedures consumed 36%, 11%, 4% and <1% of ambulatory costs. Blood pressure drugs accounted for the largest proportion of drug costs (45%). The next largest contributor to overall drug costs was lipid-lowering drugs (21%) followed by oral anti-diabetic drugs (12%).
Table 4 also presents the total cost of treating T2D in Ireland. Using a base prevalence rate of 3.9%, direct medical expenditure was estimated at 377.2 million and 4.1% of public healthcare expenditurei. Under the additional scenario with a prevalence rate of 6%, overall costs increased to 580.2 million and 6.4% of healthcare expenditure. Our analysis showed that the total cost of T2D would be around 4% lower if non-compliance with prescribed medication was taken into account. This percentage is small because drug costs were not the main cost driver.
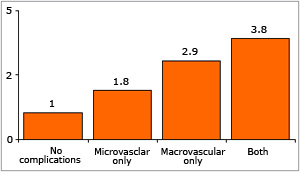 |
Figure 2: The Effect of Complications
on Average Cost per Patient |
The main cost driver was hospitalisations. This was because 60% of patients developed diabetes related complications. Figure 2 shows that compared to patients with no complications, patients with microvascular complications only and macrovascular complications only were 1.8 and 2.9 times more costly to treat respectively. Patients with both types of complications were over three and a half times more costly to treat compared to patients with no complications. Overall, the costs of complications contributed 61.7% to overall per patient costs, metabolic and risk factor management of diabetes accounted for 22.2% of overall costs and other management costs were 16.1%.
Discussion
An epidemic in T2D is unfolding because of increasing obesity, more sedentary lifestyles and an ageing population. This has consequences for the health status of the population and for the healthcare budget. This study shows that the treatment of T2D places a significant financial burden on the health care system. Although the true prevalence of T2D in Ireland is unknown, estimates of 3.9% for diagnosed diabetes and 6% for diagnosed and undiagnosed diabetes are reasonable. Using these estimates the cost of managing diagnosed diabetes is 377.2 million and both diagnosed and undiagnosed diabetes is 580.2 million a year. This corresponds to 4.1% and 6.4% of total health care expenditure respectively.
With the exception of hospitalisation costs which were lower, per patient cost estimates from the CODEIRE study were consistent with the results from the European CODE-2 study. Hospitalization costs were lower in the CODEIRE study because a lower proportion of patients in the CODEIRE study were hospitalised with shorter lengths of stay (7.3 days in CODEIRE compared with 13 days in CODE-2).10
This study did not take into account the impact of diabetes on the quality of life of patients, the economic burden (in terms of a reduction in productivity and workdays), travel costs and the loss to society from disability and premature death. Previous studies have shown that these indirect costs are likely to be as high as, if not higher than direct costs.5 As such, the estimates presented in this report are conservative if not significant underestimates of the true burden of the disease.
The high cost of managing T2D was attributable largely to the treatment and management of long term complications. Many of these complications are preventable through careful control of blood glucose levels and other risk factors. For example, the UKPDS reported that each 1% reduction in HbA1c, maintained over a 10-year period, was associated with a 21% reduction in the occurrence of any diabetes-related event, a 21% reduction in diabetes-related death, a 14% reduction in the risk of myocardial infarction and a 37% reduction in the risk of microvascular complications.16 In addition, regular eye and foot examination can prevent blindness and limb amputations.17 Preventing diabetes and its associated complications would positively impact the life expectancy and quality of life of this patient group, and could reduce the financial burden of the disease on the State and introduce substantial cost savings in the long-term. Therefore, it would appear to be a cost-effective approach for the Government to invest in prevention of diabetes and diabetes-related complications.
Clearly however, more work needs to be done in the area of estimating the financial and economic burden of T2D. First, population based estimates of the prevalence of diabetes in Ireland are required for more accurate estimates of the overall burden of the disease. Second, CODEIRE was based on the resources used by a sample of patients in four diabetes clinics around Ireland. However, many patients with T2D are cared for outside the hospital setting, for which there are no studies to date. Therefore, more work is required to ascertain if treating diabetes patients in a primary care setting is more or less costly than treating those in a hospital setting. Third, accurate Irish unit cost data are required, similar to NHS reference cost data in the UK. Fourth, the CODEIRE study was a retrospective analysis. A weakness of retrospective studies is that when there are gaps in the data they cannot be filled. For example, the number of GP visits per patient per annum was low at 0.23 and certainly an underestimate. A large prospective survey on diabetes care in Ireland is required so that accurate estimates of the burden of diabetes can be estimated. However, CODEIRE is the first study to estimate the financial burden of T2D in Ireland. As such, it is a significant step forward in raising awareness of the economic impact of this severe, debilitating and chronic disease.
References
- World Health Organisation. The World Health Report: Conquering suffering, enriching humanity. 1997,Geneva.
- International Diabetes Federation http://www.eatlas.idf.org/Prevalence (accessed 30 August 2006)
- Perry IJ, Collins A, Colwell N, et al. Established cardiovascular disease and CVD risk factors in a primary care population of middle-aged Irish men and women. Ir Med J 2002: 95(10) 298-301.
- Usher C, Creed L, Bennett K, Feely J. Prescribing for patients with diabetes in the community drug schemes in Ireland. Ir. Med. J: 2006 99 (6); 181.
- The Institute of Public Health in Ireland. Making Diabetes Count. A systematic approach to estimating population prevalence on the island of Ireland in 2005. April 2006. http://www.publichealth.ie/index.asp?locID=489&docID=591 (accessed 30 August 2006).
- DECODE Study Group on behalf of the European Diabetes Epidemiology Group. Will new diagnostic criteria for diabetes mellitus change phenotype of patients with diabetes? Re-analysis of European epidemiological data. BMJ, 1998: Vol. 317; 371:375.
- World Health Organisation. Screening for Type 2 Diabetes-Report from a World Health Organisation and International Diabetes Federation Meeting. 2003, Geneva.
- American Diabetes Association. Economic Cost of Diabetes in the US in 2002. Diab Care 2003:26; 917-932.
- Laing W, Williams R. Diabetes: a model for health care management, Office of Health Economics London, 1989.
- Kangas T, Aro S, Koivisto VA, Salinto M, Laakso M, Reunanen A. Structure and costs of health care of diabetic patients in Finland. Diab Care 1996: 19;121-9.
- Jonsson, B. Revealing the cost of Type II diabetes in Europe. Diabetologia 2002; 45: S5-S12.
- Cambridge Pharma Consultancy. Unit Cost Data for the UK. A Report for SmithKline Beecham Pharmaceuticals, 1999. Available upon request.
- http://www.cso.ie/px/pxeirestat/database/eirestat/Consumer%20Prices/ Consumer%20Prices.asp (accessed 22 May 2006)
- Beradon PHG, McGilchrist MM, McKendrick AD, McDevitt DG, MacDonald TM. Primary non-compliance with prescribed medication in primary care. BMJ1993;307:846-8.
- Central Statistics Office http://www.cso.ie/census/PreliminaryReport.htm (accessed 30 August 2006)
- See British Medical Journal on September 12 1998.
- McCabe CJ, Stevenson RC, Dolan AM. Evaluation of a diabetic foot screening and protection programme. Diab Med 1998;15 (1): 80-4.